What does offensive impact look like in Ultimate, and what statistics might we employ to measure it? This article introduces three statistical metrics that map nicely onto how we intuitively think about offense.
December 20, 2012 by Sean Childers in Analysis with 3 comments
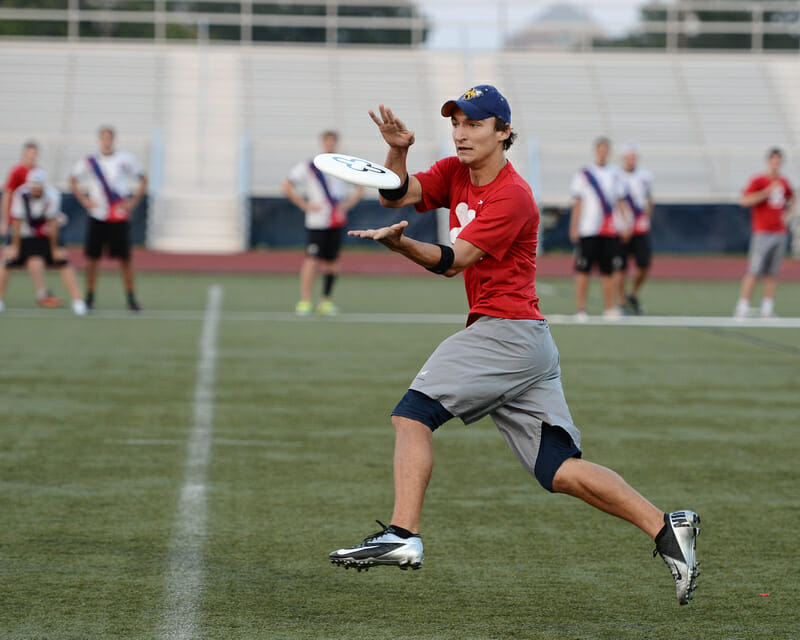
 This is the third article in a series on player and team statistics from the NexGen tour. Read more in Ultiworld’s first statistical project, The Statistics Of NexGen. Photo courtesy of Ultiphotos’ Kevin LeClaire.
What does offensive impact look like in Ultimate, and what statistics might we employ to measure it? This article introduces three statistical metrics that map nicely onto how we intuitively think about offense. The metrics also do a pretty good job of matching up with my “gut instinct” – at least with regard to the NexGen players we watched play, the stats line up to about what we’d expect (hint: Pitt stars Tyler DeGirolamo and Alex Thorne beast in these stats).
Along the way, there will be a few cautionary notes: A successful Ultimate team probably needs high-impact offensive players, but the term by itself shouldn’t be considered substitute for quality.
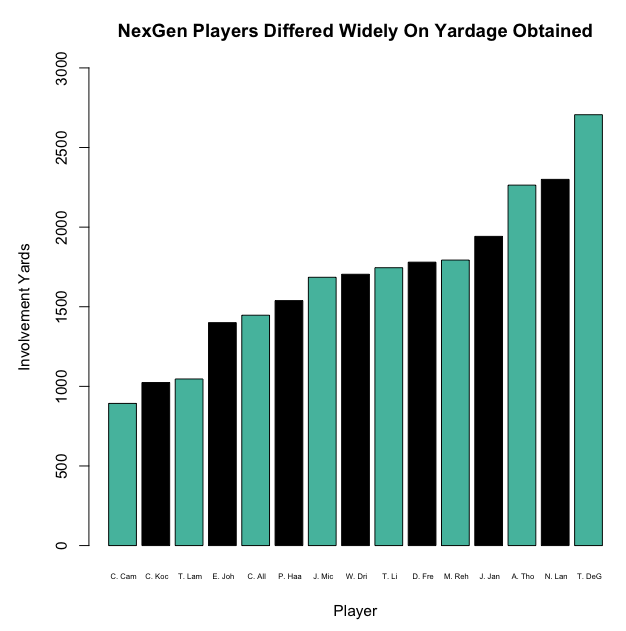
Involvement Yardage describes the amount of offensive yardage each player directly contributed to. Both the thrower and the receiver get credit for the yards obtained on a completion, but none of the other five players on the field do.1 Negative yardage throws (dumps and resets) count against the player, but incompletions don’t. Involvement yards is equal to throwing yards plus receiving yards.
This is one of the most telling and interesting graphs from our entire series. The three players on the far right (Thorne, Lance, DeGirolamo) were directly responsible for between two and three times the amount of NexGen’s offensive yardage as some of the players on the far left. Those three players had a much greater impact on and contribution to NexGen’s offense: collectively, they accounted for almost 30% of the total NexGen yardage.2 The players also vary more than we’ve typically seen in our other metrics, with some strong end points and about six or seven average players in the middle. It’s interesting to note that, even on a team full of all stars, a select group of those players really did account for a lot of the big offensive plays.
Involvement yards asks which players were responsible for obtaining yards with the disc. Usage rate, our next metric, asks which players really dominated the disc in terms of touches. The term is adopted from basketball analytics, where the end of each possession is assigned to one player on the court – the player who “used the possession.”3 Because five players play basketball at any given time, we have a baseline expectation that each player should use 20% of their team’s plays. Ball-hogging super stars use much more: Kobe Bryant and Carmelo Anthony lead the league with usage rates around 31%; role players around them have usage rates under 20%.4
Usage rate is another helpful way to think about offensive impact. Since there are seven Ultimate players on the field at once, the baseline usage expectation for any given player is 1/7, or 14.3%.5 When calculating usage in Ultimate, we’re less concerned with the termination of possession and instead focus movement of the disc.6 If your team has a dominant handler touching the disc on every other throw, he is going to have really high usage.
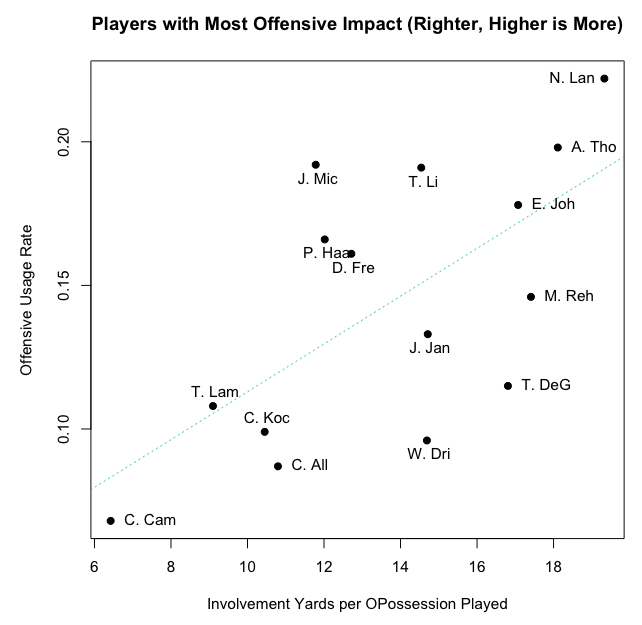
Unsurprisingly, NexGen’s handlers tend to dominate usage. But perhaps the best way to look at the usage rate graphically is to also compare it to involvement yards. The below graph, which maps both usage and involvement yards, really shows offensive impact and dominance on two dimensions.
Looking at involvement yards per OPossession played (this refers to any offensive possession, not OLine points) gives an interesting twist on involvement yards which reflects some of the playing-time choices of the NexGen players. Eric Johnson7 and DiGirolamo are probably the two biggest movers, Johnson’s position looks better because his overall involvement yards hid the fact that he played more DPossesions than OPossessions; DiGirolamo is pretty much a case of the opposite.
Looking at the data in full is the most honest representation, but I personally can’t help but sort the graph into three groups of players. The division doesn’t directly map onto the Handler/Cutter divide we identified. A few handlers and a few cutters are in the right-most group. Handlers to the far right (Lance and Thorne) are probably responsible for more hucking than handlers towards the middle of the graph (Mickle).
Low Offensive Impact — Colin Camp, Chris Kocher, Camden Allison-Hall, Tommy Lamar
This group didn’t touch the disc as much, and when they did, it was for fewer yards on average.
High Offensive Impact — Tyler DeGirolamo, Matt Rehder, Eric Johnson, Alex Thorne, Nick Lance
These players clearly averaged more yards per involvement than the rest of the group. The two handlers in the top right also were significantly more involved in terms of usage. Maybe another way to think about this group is that it represents the most offensively aggressive players.
The Guys In The Middle — Jimmy Mickle, Phillip Haas, Dylan Freechild, Tommy Li, Jacob Janin, Will Driscoll
Again we have a middle, grouped together as much by the fact that the fit into neither end.
Limits to the Offensive Impact Story:
Involvement yards and usage rates are an interesting way to think about offensive impact, but offensive impact is only one part of the key to player quality and team success. First, none of these variables map to any sense of offensive efficiency. To do that, you would need to look at completion percentage and perhaps devise a more complex overall offensive metric (we’re working on it, so stay tuned).
Second, the variables clearly don’t say anything about the players’ defensive abilities! Some of the guys in the bottom left quadrant, who had a more limited offensive impact on NexGen, also have reputations of providing athletic defense. As our first statistical series notes, defensive metrics were better predictors of NexGen success than offensive ones.
What is offensive impact good for? The usage graph helps confirm our earlier findings about a handler-cutter continuum: Handlers get involved in the offense more often than cutters; some cutters wait for the occasional chance to get involved. Cutters who go deep a lot can make this impact up by piling on receiving yards. And, as always, it will be interesting to see how this applies to other teams.
Impact also maps nicely onto a notion of “offensive players to watch.” Even if it doesn’t match up perfectly to quality of player, it does a good job of telling us who is most aggressive with both touches and in terms of attempting bigger plays.
Finally, despite this series’ focus on NexGen, the concepts are useful for younger players to keep in mind. My favorite Ultimate captain told me that the most important stat you can track in any game is the number of times you touch the disc. While this oversimplifies a bit, I think it’s a phenomenal thing to explain to young players who might otherwise be overly afraid of making mistakes. The basic intuition is that Ultimate tends to rewards aggressors, and you want your best players to be involved as much as possible. It also may be the best way to improve as a player; a simple goal of never letting your personal usage go below 12% might be a concrete way to measurably hold yourself to that aggressive mentality.
Continued thanks to Ian Guerin, Wesley Cronk, Kahyee Fong, Jeremy Weiss, and NexGen.
Of course, this is an oversimplification. For example, the player who makes a strong deep cut (opening up a big under for someone else) gets no credit for that contribution. ↩
You can bet that a lot of those yards were deep shops from Lance or Thorne to DeGirolamo. Hucks like those would essentially count twice for the collective total, since both the thrower and receiver get involvement yardage credit. ↩
Whether the possession ends because of a turnover or a shot is immaterial for a usage metric. ↩
http://insider.espn.go.com/nba/hollinger/statistics/_/sort/usageRate ↩
Formally, we count each reception as a use, as well as assigning usage to the player who first picks up a disc after the turn or on a pull. ↩
Formally, usage rate is thus defined as the percent of the total touches by your team (while you were on the field) where you were the player with the touch. ↩
Expect an article in the future on Eric Johnson’s playing time and statistical metrics; he’s a bit of an outlier in our data. ↩

